Wandsworth an 'Oasis in London Property Desert'
High prices still being paid for river view apartments and family homes
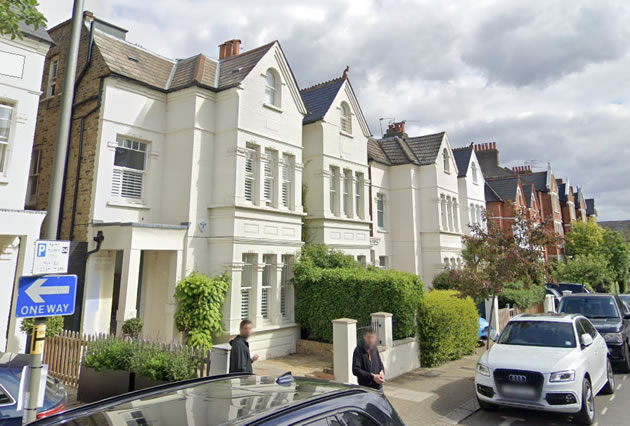 Two houses in Henderson Road sold for over £3million. Picture: Google Streetview
November 19, 2019
With other areas of London seeing property transactions grinding to a standstill, Wandsworth is continuing to ignore economic and political uncertainty and experiencing relatively healthy turnover.
According to the Land Registry, 254 homes have been reported as sold so far in the SW18 postcode area during the third quarter of this year. This is not high by historic standards but other districts have seen a collapse in activity not seen since the financial crisis the best part of a decade ago.
When asked why Wandsworth appeared to be so resilient, a local estate agent responded, "It is a bit of an oasis in a London property desert. You have to look at the quality of the housing stock in the area. Two things that will always be in demand are larger family homes and river views and Wandsworth has both. In addition, flats are selling well in the area because of the proximity of the Northern line extension and prices below the half a million mark which is where demand is concentrated at the moment."
The average price of a home sold in the area from July to September was just below three quarters of a million at £745,012 a 7.1% rise on the same period last year.
The average terraced property continues to hover around the million pound mark and demand remains high for larger houses with four changing hands for over two million. Two of these were on Henderson Road the most expensive of which cost £3,625,000.
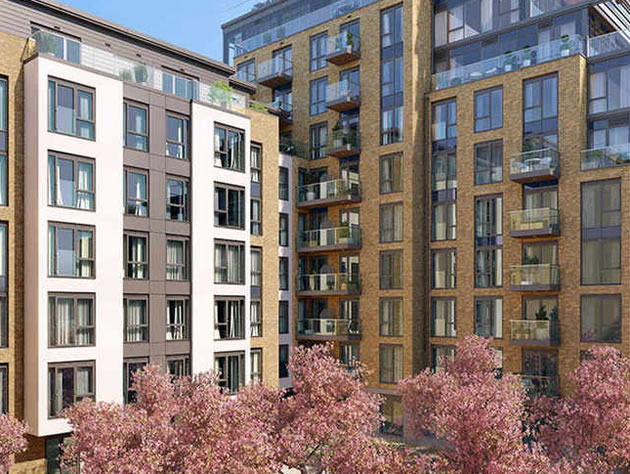
Discovery House, Battersea Reach
There were 150 flats sold during the period, 30 of which were new builds and over half of those were in Jessica House in Red Lion Square. An apartment with a river view in Berkeley's Discovery House on Battersea Reach sold for £2,400,000.
Property Prices in Wandsworth SW18 (July - September 2019) |
||||||||||
| Area | Detached | Sales | Semi-det | Sales | Terraced | Sales | Flat/ mais |
Sales | Overall average | Total sales |
|---|---|---|---|---|---|---|---|---|---|---|
| SW18 1 | 0 | 0 | 1016667 | 3 | 905174 | 9 | 526305 | 44 | 613464 | 56 |
| SW18 2 | 0 | 0 | 1696509 | 2 | 1141591 | 11 | 484993 | 22 | 760582 | 35 |
| SW18 3 | 3300000 | 1 | 2421000 | 5 | 977005 | 28 | 532562 | 24 | 957632 | 58 |
| SW18 4 | 0 | 0 | 675000 | 1 | 879147 | 17 | 446675 | 41 | 575156 | 59 |
| SW18 5 | 0 | 0 | 1100000 | 4 | 1067087 | 23 | 517839 | 19 | 843086 | 46 |
| Total | 3300000 | 1 | 1574868 | 15 | 994872 | 88 | 498409 | 150 | 745012 | 254 |
| Change in quarter | - | - | 32.6% | 7.1% | -2.9% | 29.4% | -11.1% | 2.0% | -0.1% | 10.4% |
| Change in year | - | - | 1.6% | -25.0% | -4.2% | -6.4% | 3.0% | -38.5% | 7.0% | -29.4% |
| Change in three years | - | - | -4.2% | 87.5% | -11.8% | 2.3% | -12.5% | -18.0% | -6.9% | -9.9% |
| Change in five years | - | - | -23.1% | -11.8% | -0.3% | -9.3% | -6.6% | -26.1% | -2.1% | -20.6% |
| Change in ten years | - | - | 48.6% | -25.0% | 73.4% | -36.2% | 57.8% | -18.9% | 57.9% | -27.0% |
The Land Registry House Price Index for August 2019 shows that overall prices were down by 1.4% in London which made it the worse performing area in the UK. For the country as a whole the average price rose by 1.3% to £234,853.
The Royal Institution of Chartered Surveyors’ (RICS) August 2019 UK Residential Market Survey reported a flat trend in demand (new buyer enquiries) at the national level, following a few months in which enquiries had increased modestly. Newly agreed sales moved slightly further into negative territory. Alongside this, new instructions to sell were broadly unchanged for the third successive report.
The Bank of England’s Agents‘ summary of business conditions – 2019 Q3 reported that the housing market continued to soften, reflecting deteriorating supply and demand. Estate agents reported softer demand in the secondary market, though demand for lower-priced properties was more resilient.
The UK Property Transactions Statistics for August 2019 showed that on a seasonally adjusted basis, the estimated number of transactions on residential properties with a value of £40,000 or greater was 99,890. This is 0.9% higher than a year ago. Between July 2019 and August 2019, transactions increased by 15.8%.
The Bank of England’s Money and Credit release reported that mortgage approvals for house purchase (an indicator of future lending) decreased in August 2019 to 65,500. This is down from the previous peak seen in July 2019 of 67,000 but remained within the narrow range seen over the past 3 years
.